剪力图与弯矩图
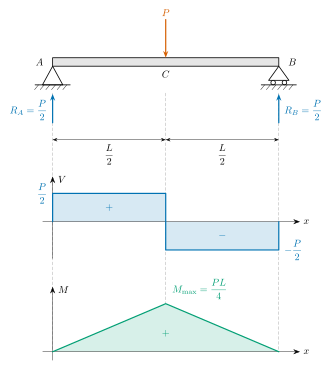
剪力图和弯矩图表示梁的内力沿梁长的变化。这是每门课程最先讲的情形:跨度为 L 的梁,A 端为固定铰支座,B 端为滚动支座,在跨中 C 处承受一个荷载 P。
三幅图共用一条 x 轴,所以可以从上往下直接对照着读:最上面是荷载和支座反力,接着是它们引起的剪力 V,然后是由剪力累积而成的弯矩 M。切换到空白版可以练习,也可以拿下方的 TikZ 代码加以修改。
各部分及其含义
| 部分 | 表示什么 |
|---|---|
| 梁 | 两支座之间的跨度为 L。不计梁的自重。 |
| 固定铰支座 A | 支撑梁,并阻止它水平移动。 |
| 滚动支座 B | 只支撑梁,所以它的反力是竖直的。 |
| 荷载 P | 作用在跨中 C 处的一个集中荷载。 |
| 支座反力 | A、B 两处支座向上的力。由对称性可知各为 P/2。 |
| 剪力 V | 梁在 x 处横截面上的内力。从 A 到 C 为 +P/2,从 C 到 B 为 −P/2。 |
| 弯矩 M | 梁在 x 处的内力矩。它从 A 处的 0 沿直线上升到 C 处的 PL/4,再回落到 B 处的 0。 |
从左到右读这张图
从 A 出发沿着梁走。支座反力使剪力升到 +P/2。到跨中之前没有别的力作用,所以剪力保持水平。在 C 处荷载向下压,剪力正好下降 P,变为 −P/2。它一直保持这个值,直到 B 处的支座反力把它拉回到零。剪力图如果最后不回到零,说明支座反力算错了。
某一点的弯矩等于剪力图到该点为止的面积,因为剪力就是弯矩图的斜率。恒定的正剪力使弯矩沿直线上升,剪力变号的地方弯矩达到峰值。第一个矩形的面积是 P/2 × L/2 = PL/4,这就是荷载下方的最大弯矩。第二个矩形大小相同而符号为负,所以弯矩在 B 处回到零,这也是必然的:铰支座和滚动支座都不能承受弯矩。
有三条规律适用于任何梁:
- 集中荷载使剪力图出现突变,使弯矩图出现折角。
- 弯矩图的斜率等于剪力。
- 剪力过零的地方弯矩最大。
这张图上没有表示的内容
- 其他荷载。沿梁均匀分布的荷载使剪力图成为斜直线、弯矩图成为抛物线,对同一根梁最大弯矩为 wL²/8。上面三条规律仍然成立。
- 各种教材的符号约定。这里规定使梁下侧受拉(向下弯)的弯矩为正,并画在轴线上方。许多结构工程师则把弯矩画在梁的受拉一侧,这样这张图就会上下颠倒。数值不变。
- 应力和挠度。这两张图给出的是内力和内力矩。弯曲正应力再由 σ = My/I 求得,挠度则取决于梁的抗弯刚度 EI。
- 梁的自重,以及任何沿梁轴线方向的力。
TikZ 代码
这是上面这张图的完整源代码。无需修改即可用 pdflatex 编译,在 LatexNotes、Overleaf 或你自己的电脑上都可以。
% Shear force and bending moment diagrams of a simply supported beam with a point load P at midspan.
% The three drawings share one x axis, so every feature lines up. Compiles as it is with pdflatex.
% Free to use and change: latexnotes.tech/diagrams/shear-force-bending-moment-diagram
\documentclass[tikz,border=6pt]{standalone}
\usepackage{amsmath}
\usetikzlibrary{arrows.meta,positioning}

\definecolor{load}{HTML}{D55E00}     % the applied load
\definecolor{shear}{HTML}{0072B2}    % the reactions and the shear force
\definecolor{moment}{HTML}{009E73}   % the bending moment

\newif\iflabels
\labelstrue   % write \labelsfalse here for the blank version to fill in

\newcommand{\Len}{8}       % the span L, as drawn, in cm
\newcommand{\Vh}{1.0}      % the height drawn for a shear force of P/2
\newcommand{\Mh}{1.7}      % the height drawn for a bending moment of PL/4
\newcommand{\Vzero}{-5.5}  % where the shear diagram's zero line sits
\newcommand{\Mzero}{-10.1} % where the moment diagram's zero line sits

\begin{document}
\begin{tikzpicture}[>={Stealth[length=2.4mm]}, line cap=round, line join=round]
  \pgfmathsetmacro{\mid}{\Len/2}

  % Lines down from the supports and the load, tying the three drawings together
  \foreach \x in {0,\Len}
    \draw[thin, densely dashed, black!40] (\x,-0.95) -- (\x,\Mzero);
  \draw[thin, densely dashed, black!40] (\mid,-0.95) -- (\mid,\Mzero+\Mh);

  % ---- The beam: a pin at A, a roller at B, the load P at midspan C ----
  \filldraw[thick, fill=black!10] (0,0) rectangle (\Len,0.3);
  % the pin (it holds the beam up and stops it sliding)
  \filldraw[thick, fill=white] (0,0) -- (-0.36,-0.66) -- (0.36,-0.66) -- cycle;
  % the roller (it only holds the beam up)
  \filldraw[thick, fill=white] (\Len,0) -- (\Len-0.36,-0.5) -- (\Len+0.36,-0.5) -- cycle;
  \foreach \dx in {-0.2,0.2} \filldraw[thick, fill=white] (\Len+\dx,-0.58) circle (0.08);
  % the ground under each support
  \foreach \x in {0,\Len} {
    \draw[thick] (\x-0.62,-0.66) -- (\x+0.62,-0.66);
    \foreach \i in {-0.5,-0.3,...,0.5} \draw (\x+\i,-0.66) -- ++(-0.14,-0.17);
  }
  % the load and the two reactions that balance it
  \draw[->, very thick, load] (\mid,1.65) -- (\mid,0.3);
  \draw[->, very thick, shear] (0,-2.0) -- (0,-0.98);
  \draw[->, very thick, shear] (\Len,-2.0) -- (\Len,-0.98);
  % the two half spans
  \draw[{Stealth[length=1.7mm]}-{Stealth[length=1.7mm]}, thin] (0,-2.6) -- (\mid,-2.6);
  \draw[{Stealth[length=1.7mm]}-{Stealth[length=1.7mm]}, thin] (\mid,-2.6) -- (\Len,-2.6);

  % ---- The shear force V: +P/2 up to the load, then it drops by P to -P/2 ----
  \fill[shear!16] (0,\Vzero) rectangle (\mid,\Vzero+\Vh);
  \fill[shear!16] (\mid,\Vzero) rectangle (\Len,\Vzero-\Vh);
  \draw[->, thin] (-0.35,\Vzero) -- (\Len+0.75,\Vzero);
  \draw[->, thin] (0,\Vzero-\Vh-0.3) -- (0,\Vzero+\Vh+0.6);
  \draw[very thick, shear] (0,\Vzero) -- (0,\Vzero+\Vh) -- (\mid,\Vzero+\Vh)
      -- (\mid,\Vzero-\Vh) -- (\Len,\Vzero-\Vh) -- (\Len,\Vzero);

  % ---- The bending moment M: a straight rise to PL/4 under the load, and back to zero ----
  \fill[moment!16] (0,\Mzero) -- (\mid,\Mzero+\Mh) -- (\Len,\Mzero) -- cycle;
  \draw[->, thin] (-0.35,\Mzero) -- (\Len+0.75,\Mzero);
  \draw[->, thin] (0,\Mzero-0.3) -- (0,\Mzero+\Mh+0.6);
  \draw[very thick, moment] (0,\Mzero) -- (\mid,\Mzero+\Mh) -- (\Len,\Mzero);

  \iflabels
    \node[above, load] at (\mid,1.65) {$P$};
    \node[left=6pt] at (0,0.15) {$A$};
    \node[right=6pt] at (\Len,0.15) {$B$};
    \node[below=1pt] at (\mid,0) {$C$};
    \node[left=2pt, shear] at (0,-1.55) {$R_A=\dfrac{P}{2}$};
    \node[right=2pt, shear] at (\Len,-1.55) {$R_B=\dfrac{P}{2}$};
    \node[below=1pt] at (\mid/2,-2.6) {$\dfrac{L}{2}$};
    \node[below=1pt] at (\mid*1.5,-2.6) {$\dfrac{L}{2}$};
    % shear
    \node[right=2pt] at (0,\Vzero+\Vh+0.5) {$V$};
    \node[right] at (\Len+0.75,\Vzero) {$x$};
    \node[left=2pt, shear] at (0,\Vzero+\Vh) {$\dfrac{P}{2}$};
    \node[right=2pt, shear] at (\Len,\Vzero-\Vh) {$-\dfrac{P}{2}$};
    \node[shear] at (\mid/2,\Vzero+\Vh/2) {$+$};
    \node[shear] at (\mid*1.5,\Vzero-\Vh/2) {$-$};
    % moment
    \node[right=2pt] at (0,\Mzero+\Mh+0.5) {$M$};
    \node[right] at (\Len+0.75,\Mzero) {$x$};
    \node[above right=1pt and 3pt, moment] at (\mid,\Mzero+\Mh) {$M_{\max}=\dfrac{PL}{4}$};
    \node[moment] at (\mid,\Mzero+\Mh/2.6) {$+$};
  \fi
\end{tikzpicture}
\end{document}
\Len是图中梁的跨度,\Vh和\Mh分别是 P/2 和 PL/4 的绘制高度。- 剪力图和弯矩图的形状是由各个转折点连成的,所以换一种荷载情形,只需修改这些点和标注。
- 荷载、剪力和弯矩的颜色由开头的三行
\definecolor设定。 - 要得到空白版,把
\labelstrue改成\labelsfalse。
自己手绘了一张图?
LatexNotes 能把手写笔记的照片转换成 LaTeX,并把手绘的图形和图解重绘为可编辑的 TikZ 和 pgfplots,就像上面的代码一样。
常见问题
为什么最大弯矩是 PL/4?
在跨中把梁截开,看左半段。它只受到支座反力 P/2 的作用,作用点到截面的距离为 L/2。截面上的弯矩就是 P/2 × L/2,即 PL/4。
弯矩在哪里最大?
在剪力为零或变号的地方,因为剪力就是弯矩图的斜率。对这根梁来说,就是荷载的正下方。
为什么剪力在荷载处发生突变?
集中荷载被看作作用在一个点上,所以剪力在这一点的两侧相差整个 P。实际的荷载分布在一小段长度上,突变就变成了一段很陡的斜线。
正弯矩画在轴线上方还是下方?
两种画法都有人用。力学教材通常把使梁下侧受拉的弯矩取为正,画在轴线上方,本页就是这样。结构图纸则常把弯矩画在受拉一侧,对向下弯的梁来说就是轴线下方。请说明你用的是哪一种。
我可以在自己的笔记里使用这张图吗?
可以。下载图片,或复制 TikZ 代码并随意修改。它可以免费用于笔记、幻灯片和练习题。
参考资料与延伸阅读
- Baker and Haynes, Engineering Statics: Open and Interactive, section 8.4: Shear and Bending Moment Diagrams
- Baker and Haynes, Engineering Statics: Open and Interactive, section 8.5: Relations between Loading, Shear and Moment